 Data Analytics and Visualization
Dallotech specializes in harnessing the power of data through advanced analytics, translating complex information into stunning graphs and visual representations. Explore our expertise in transforming raw data into compelling visual narratives.

Elevate Your Data Insights with Dallotech
In today's data-driven landscape, Dallotech is dedicated to crafting exceptional data analytics and visualization experiences that empower businesses to decipher complex information effectively. Our Data Analytics and Visualization services are tailored to meet your unique data needs, ensuring insightful interpretations across diverse datasets.
Expertise in Transformative Data Visualization Tools
At Dallotech, we harness the power of cutting-edge data visualization tools to deliver insightful and visually compelling representations. Our adept team leverages advanced tools to transform raw data into visually engaging graphs, charts, and interactive visual narratives.
Designing Informative Dashboards & Intuitive Data Experiences
We take pride in creating visually captivating dashboards complemented by intuitive data experiences. Our focus on user-centric design ensures seamless navigation and engaging data experiences, enhancing data comprehension and decision-making.
Performance & Scalability for Robust Insights
Dallotech places paramount importance on data performance and scalability. We engineer data analytics solutions with scalability in mind, enabling seamless integration of new data sources without compromising performance. Our optimized approach ensures swift data processing and analysis, fostering informed decision-making.
Seamless Integration with Advanced Analytics Tools
Our integration strategy involves leveraging robust analytics tools to ensure a smooth transition from data collection to insightful analysis. We meticulously handle data integration processes, ensuring comprehensive analysis and actionable insights for your business.
Partner with Dallotech for Data Excellence
Experience the difference with Dallotech's commitment to crafting exceptional data analytics and visualization solutions. Enhance your data understanding, derive actionable insights, and drive informed strategies seamlessly with our expert data services.
Projects under “Data Analytics and Visualization”
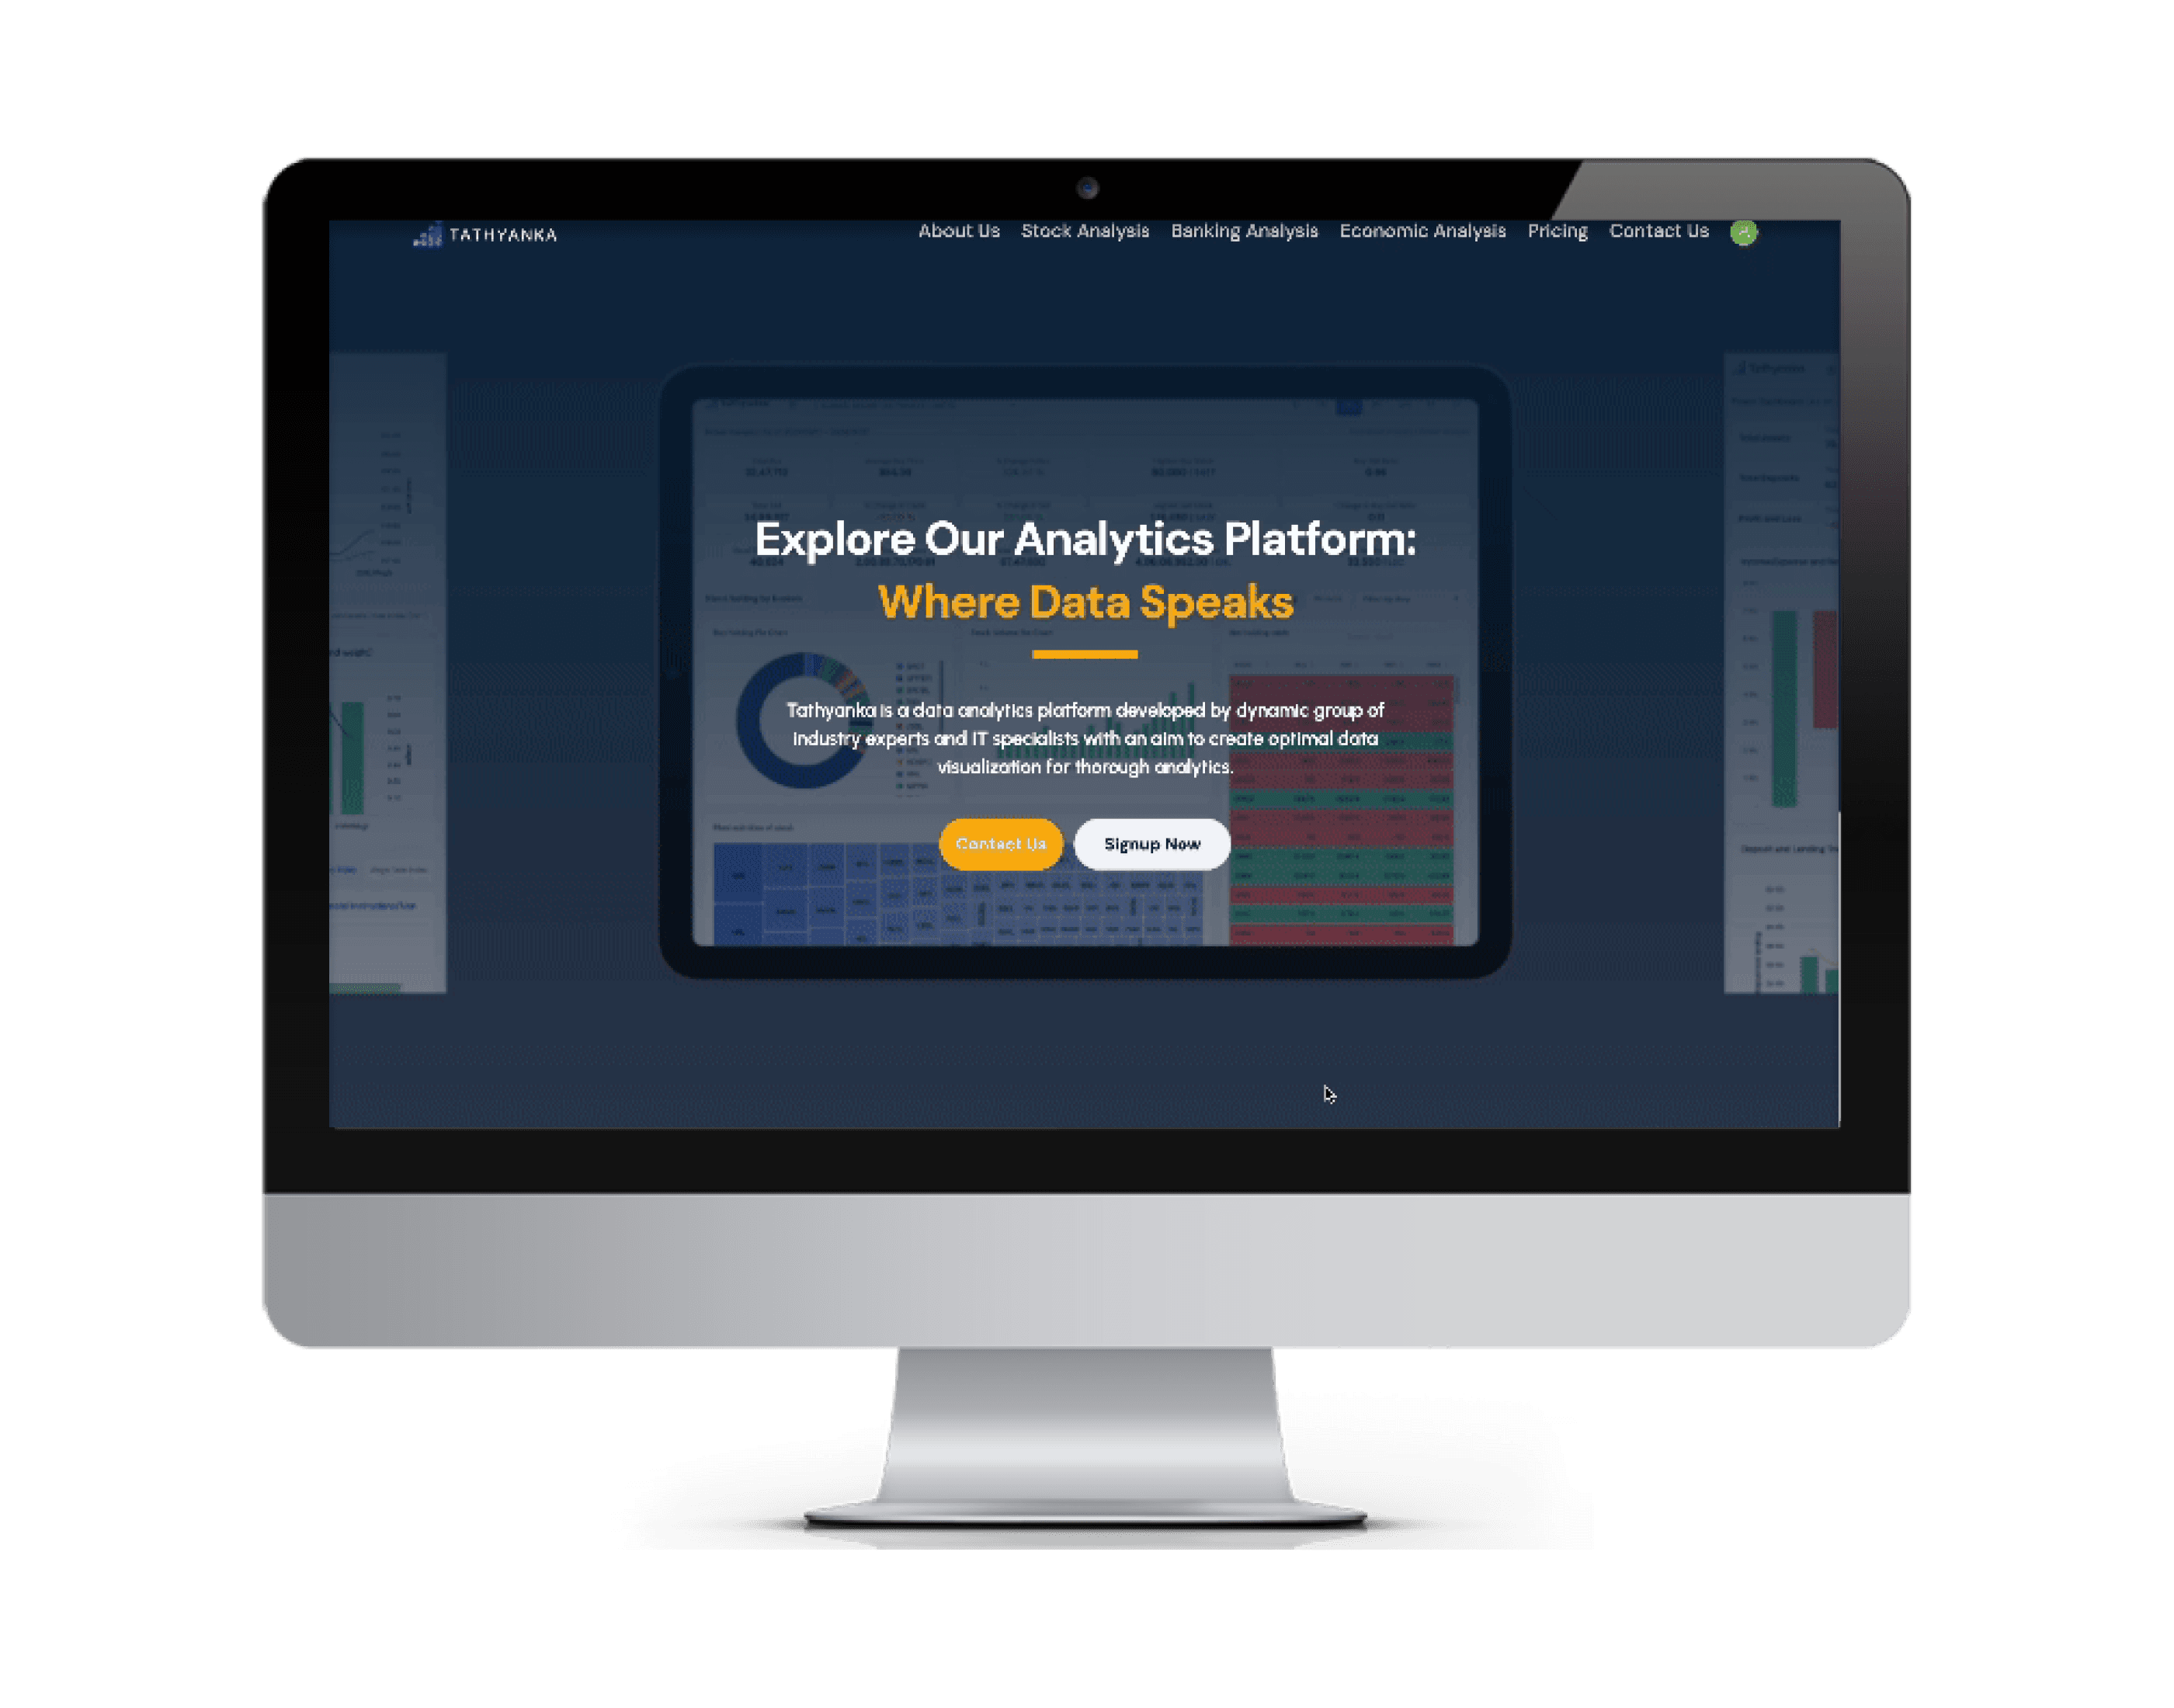
Tathyanka is a data analytics platform based on financial analysis of Nepal. Dallo Tech was involved in both analytics and data visualization of this system



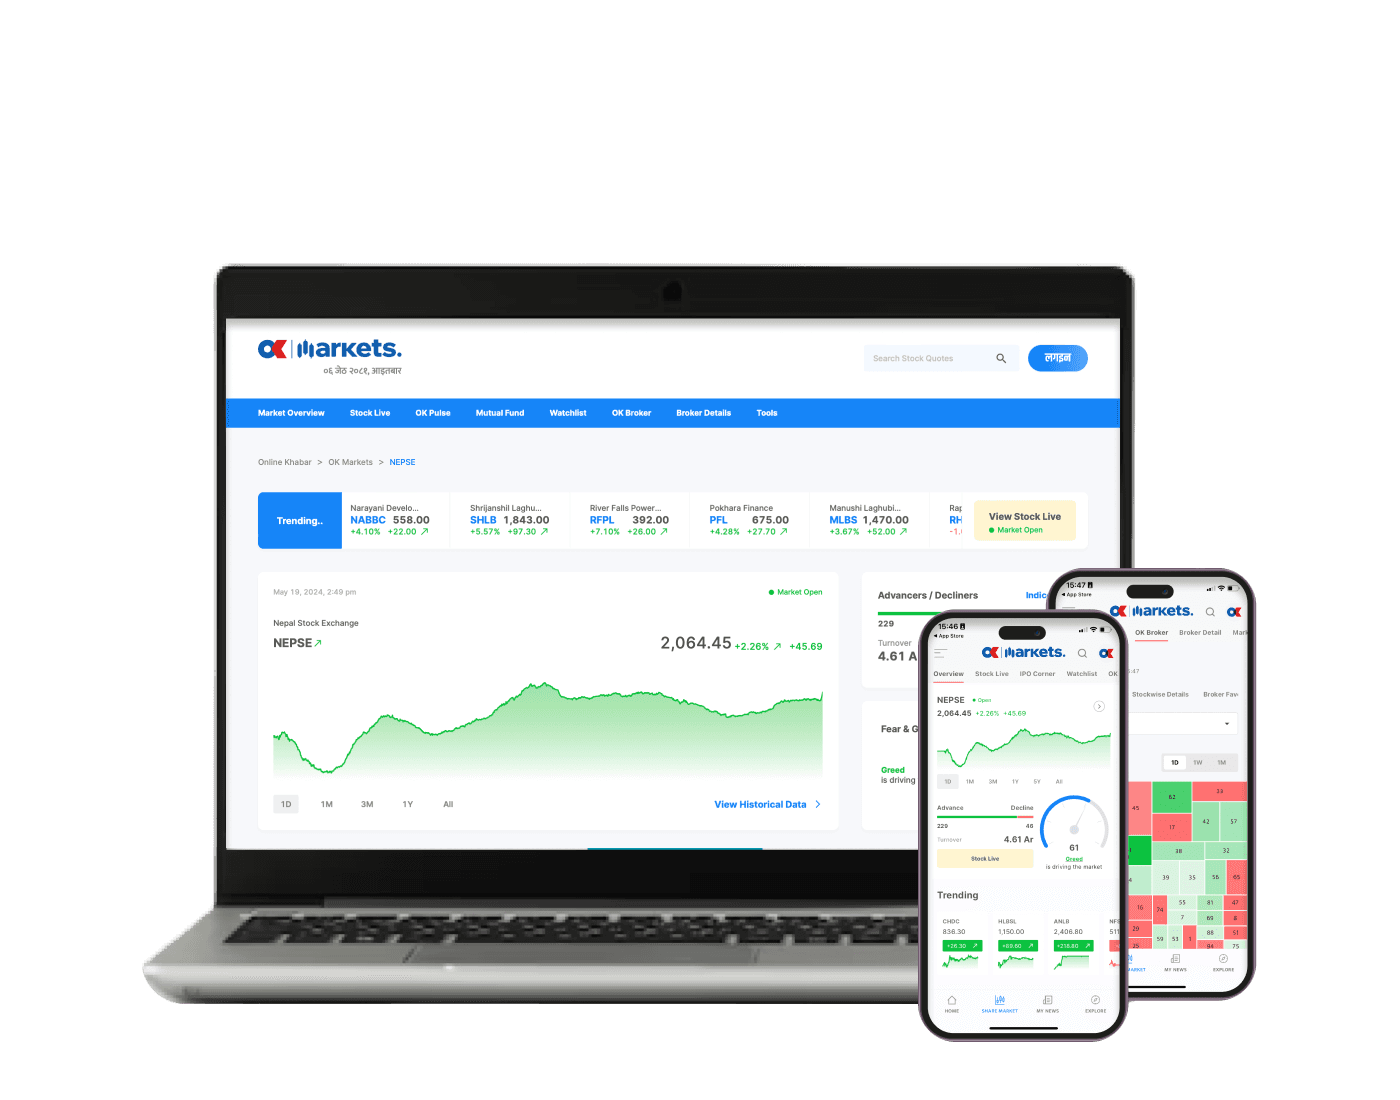
Online Khabar Market is a leading platform of stock market data analytics and visualization. Dallo Tech was involved in developing the market section of Mobile app and website

Yes, at Dallotech, we leverage a suite of cutting-edge technologies such as Python, Pandas, D3.js, and Chart.js for our data analytics and visualization services. These tools enable us to process data efficiently and create visually appealing and interactive representations.
Python and Pandas form the core of our data analytics toolkit. We harness the capabilities of Python's versatile programming language and Pandas' powerful data manipulation and analysis tools to process, clean, and analyze large datasets effectively.
At Dallotech, both D3.js and Chart.js are pivotal components of our data visualization arsenal. D3.js, a JavaScript library, empowers us to create dynamic and interactive data visualizations on the web, enabling the crafting of visually stunning graphs and charts that enhance data representation. Similarly, Chart.js serves as another vital JavaScript library within our strategy, enabling the development of responsive, feature-rich visual representations. These tools collectively elevate the clarity and comprehension of data, offering our clients a rich and insightful visualization experience.
Absolutely, at Dallotech, we provide consultancy and guidance in selecting the most suitable technology stack tailored to your data analytics and visualization requirements. We aim to optimize the technology choices to best align with your business objectives and data processing needs.
Dallotech employs advanced data visualization techniques specifically tailored for stock market data. We utilize cutting-edge visualization tools and techniques, such as candlestick charts, time series analysis, and real-time data representation, to provide comprehensive insights into stock market trends, price movements, and trading patterns. Our focus is on crafting visually intuitive and informative representations that enable investors and traders to make informed decisions in the dynamic stock market landscape.
Dallotech excels in leveraging advanced visualization tools like Syncfusion and fl_charts within Flutter applications. Syncfusion offers a rich set of widgets and features that enable us to create visually appealing and interactive charts, graphs, and data representations, enhancing the overall user experience. Additionally, we harness the capabilities of fl_charts, a versatile Flutter charting library, to develop customizable and dynamic charts with ease. By seamlessly integrating these powerful visualization tools, we ensure that our Flutter apps provide comprehensive and visually engaging data representations for better user interaction and understanding.