Tathyanka
Tathyanka is a data analytics platform based on financial analysis of Nepal. Dallo Tech was involved in both analytics and data visualization of this system

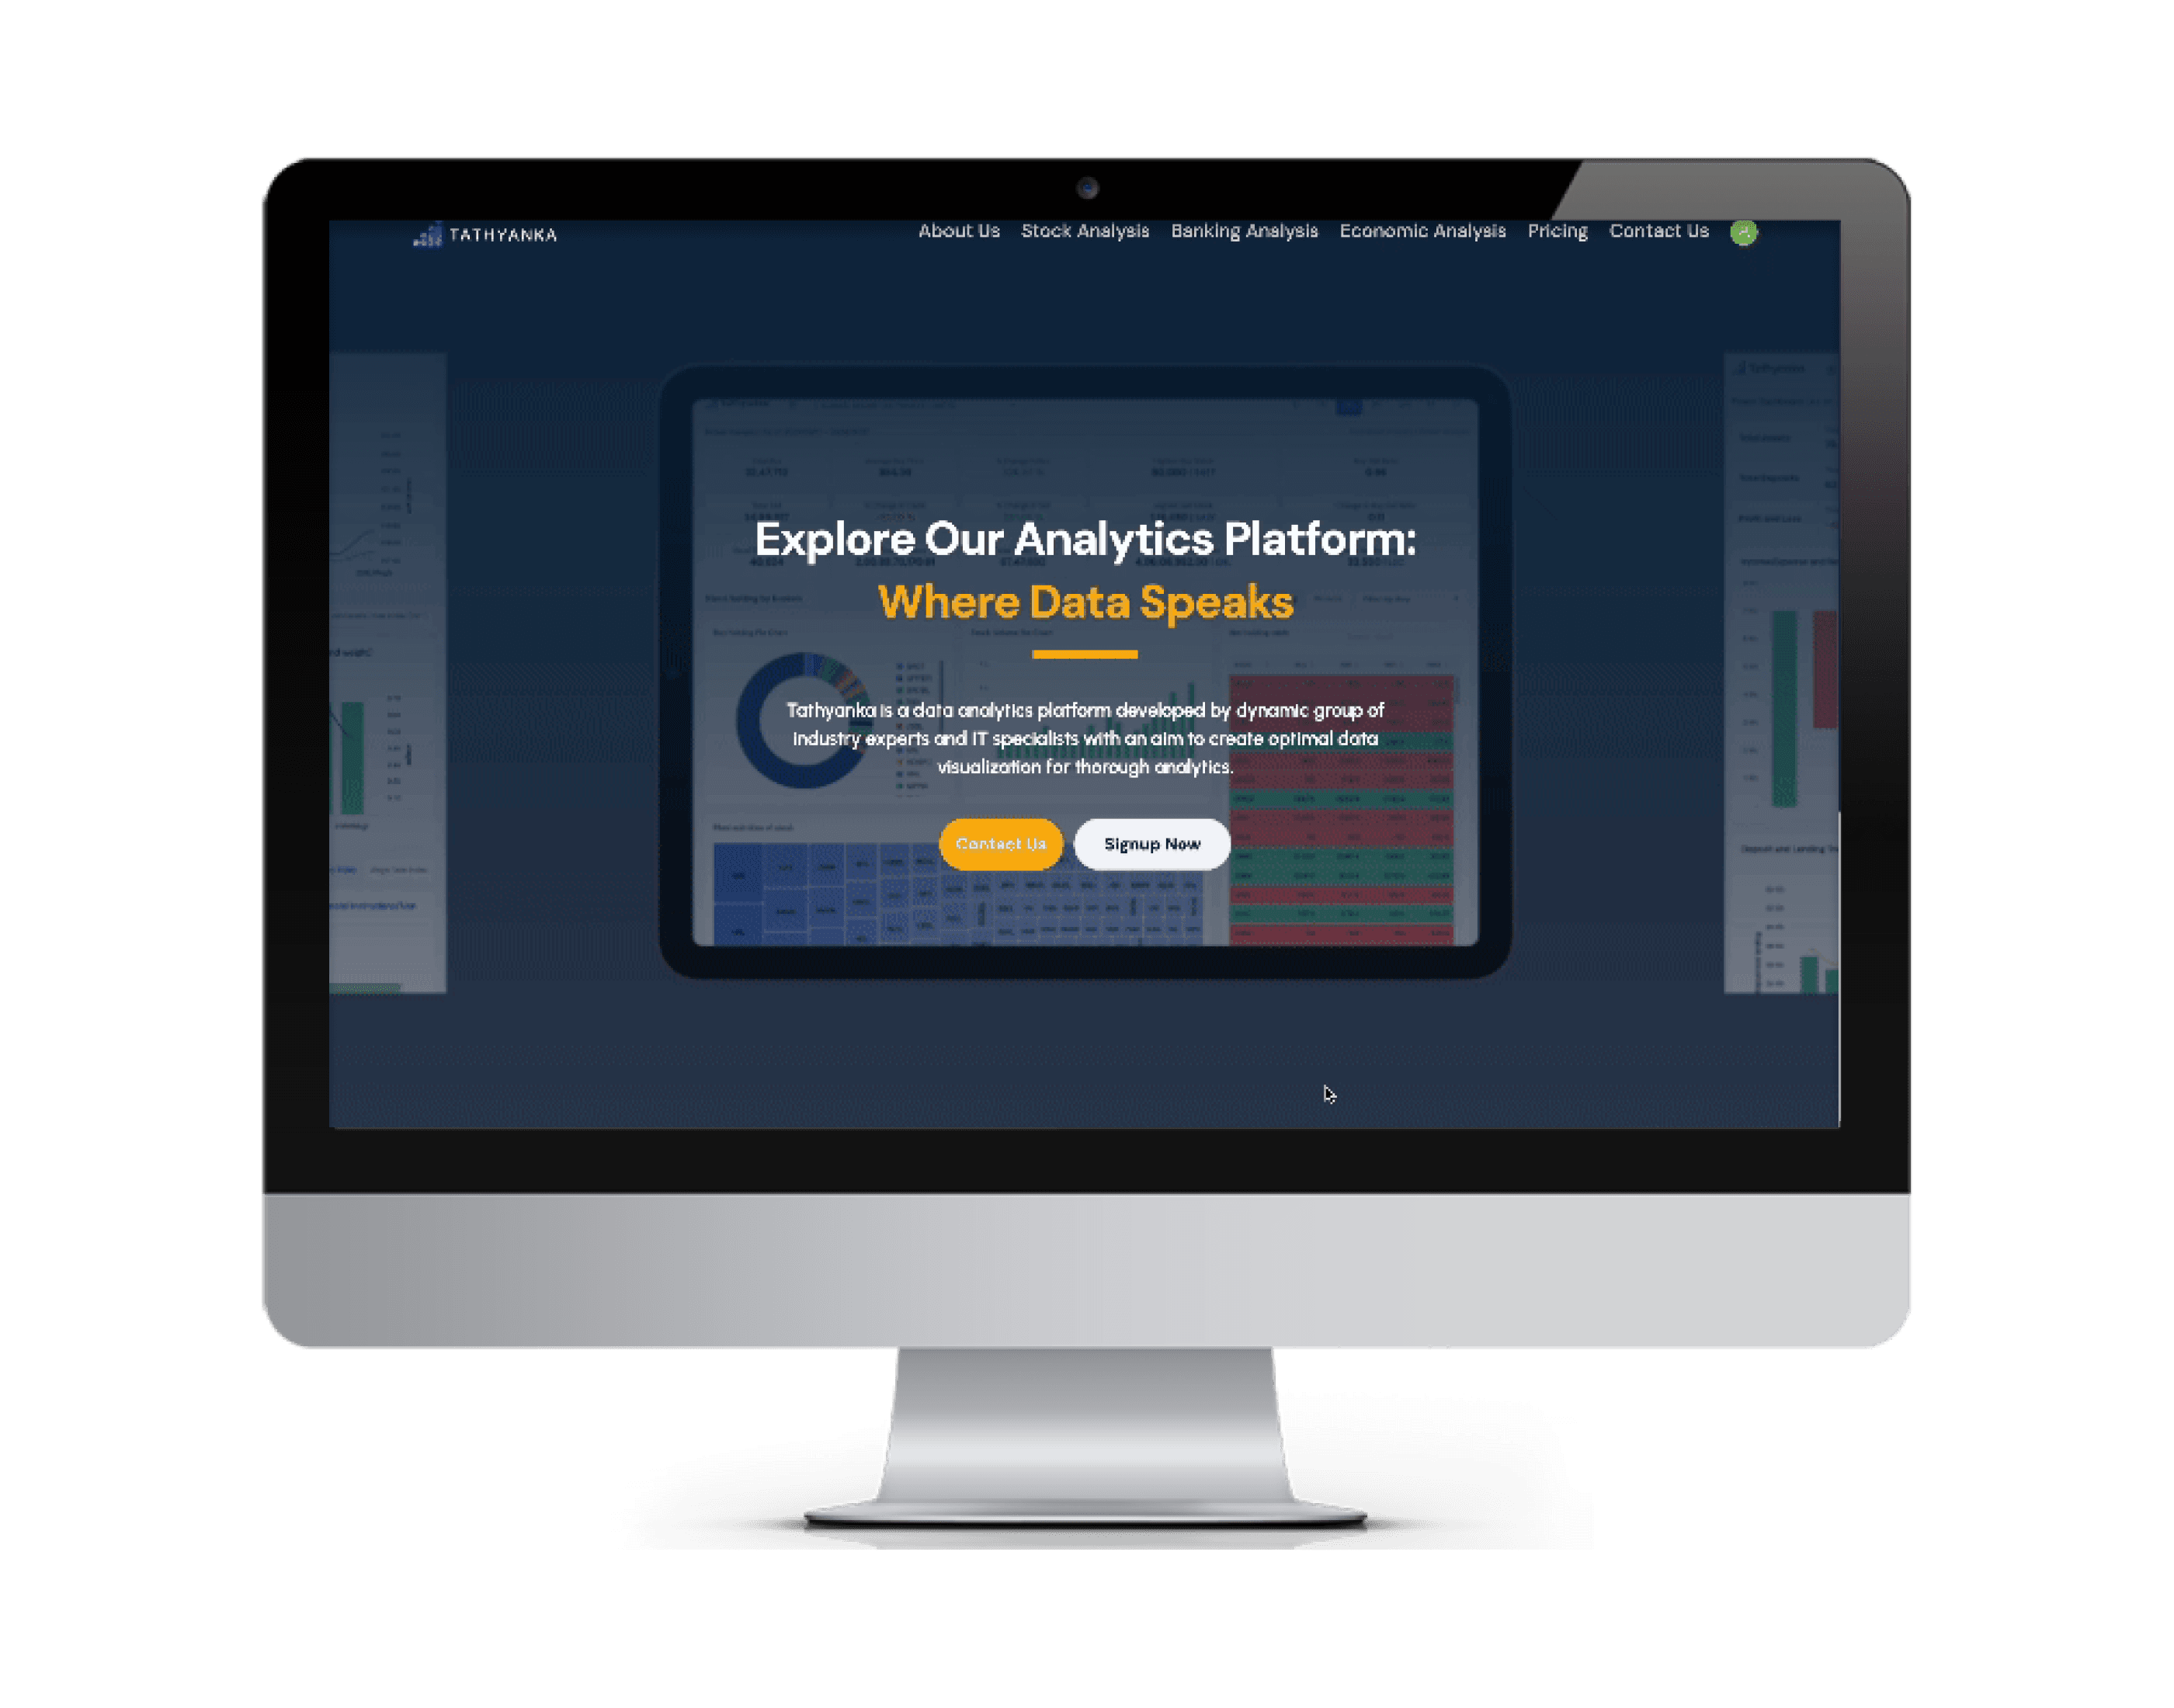
Tathyanka is an advanced and comprehensive economic analysis platform that offers an extensive array of services in data analysis and visualization across multiple vital categories. At its core, Tathyanka specializes in
Stock Analysis
Tathyanka provides detailed insights on the stock market of Nepal. The stock analysis section is further divided into two parts
a. Floorsheet Analysis
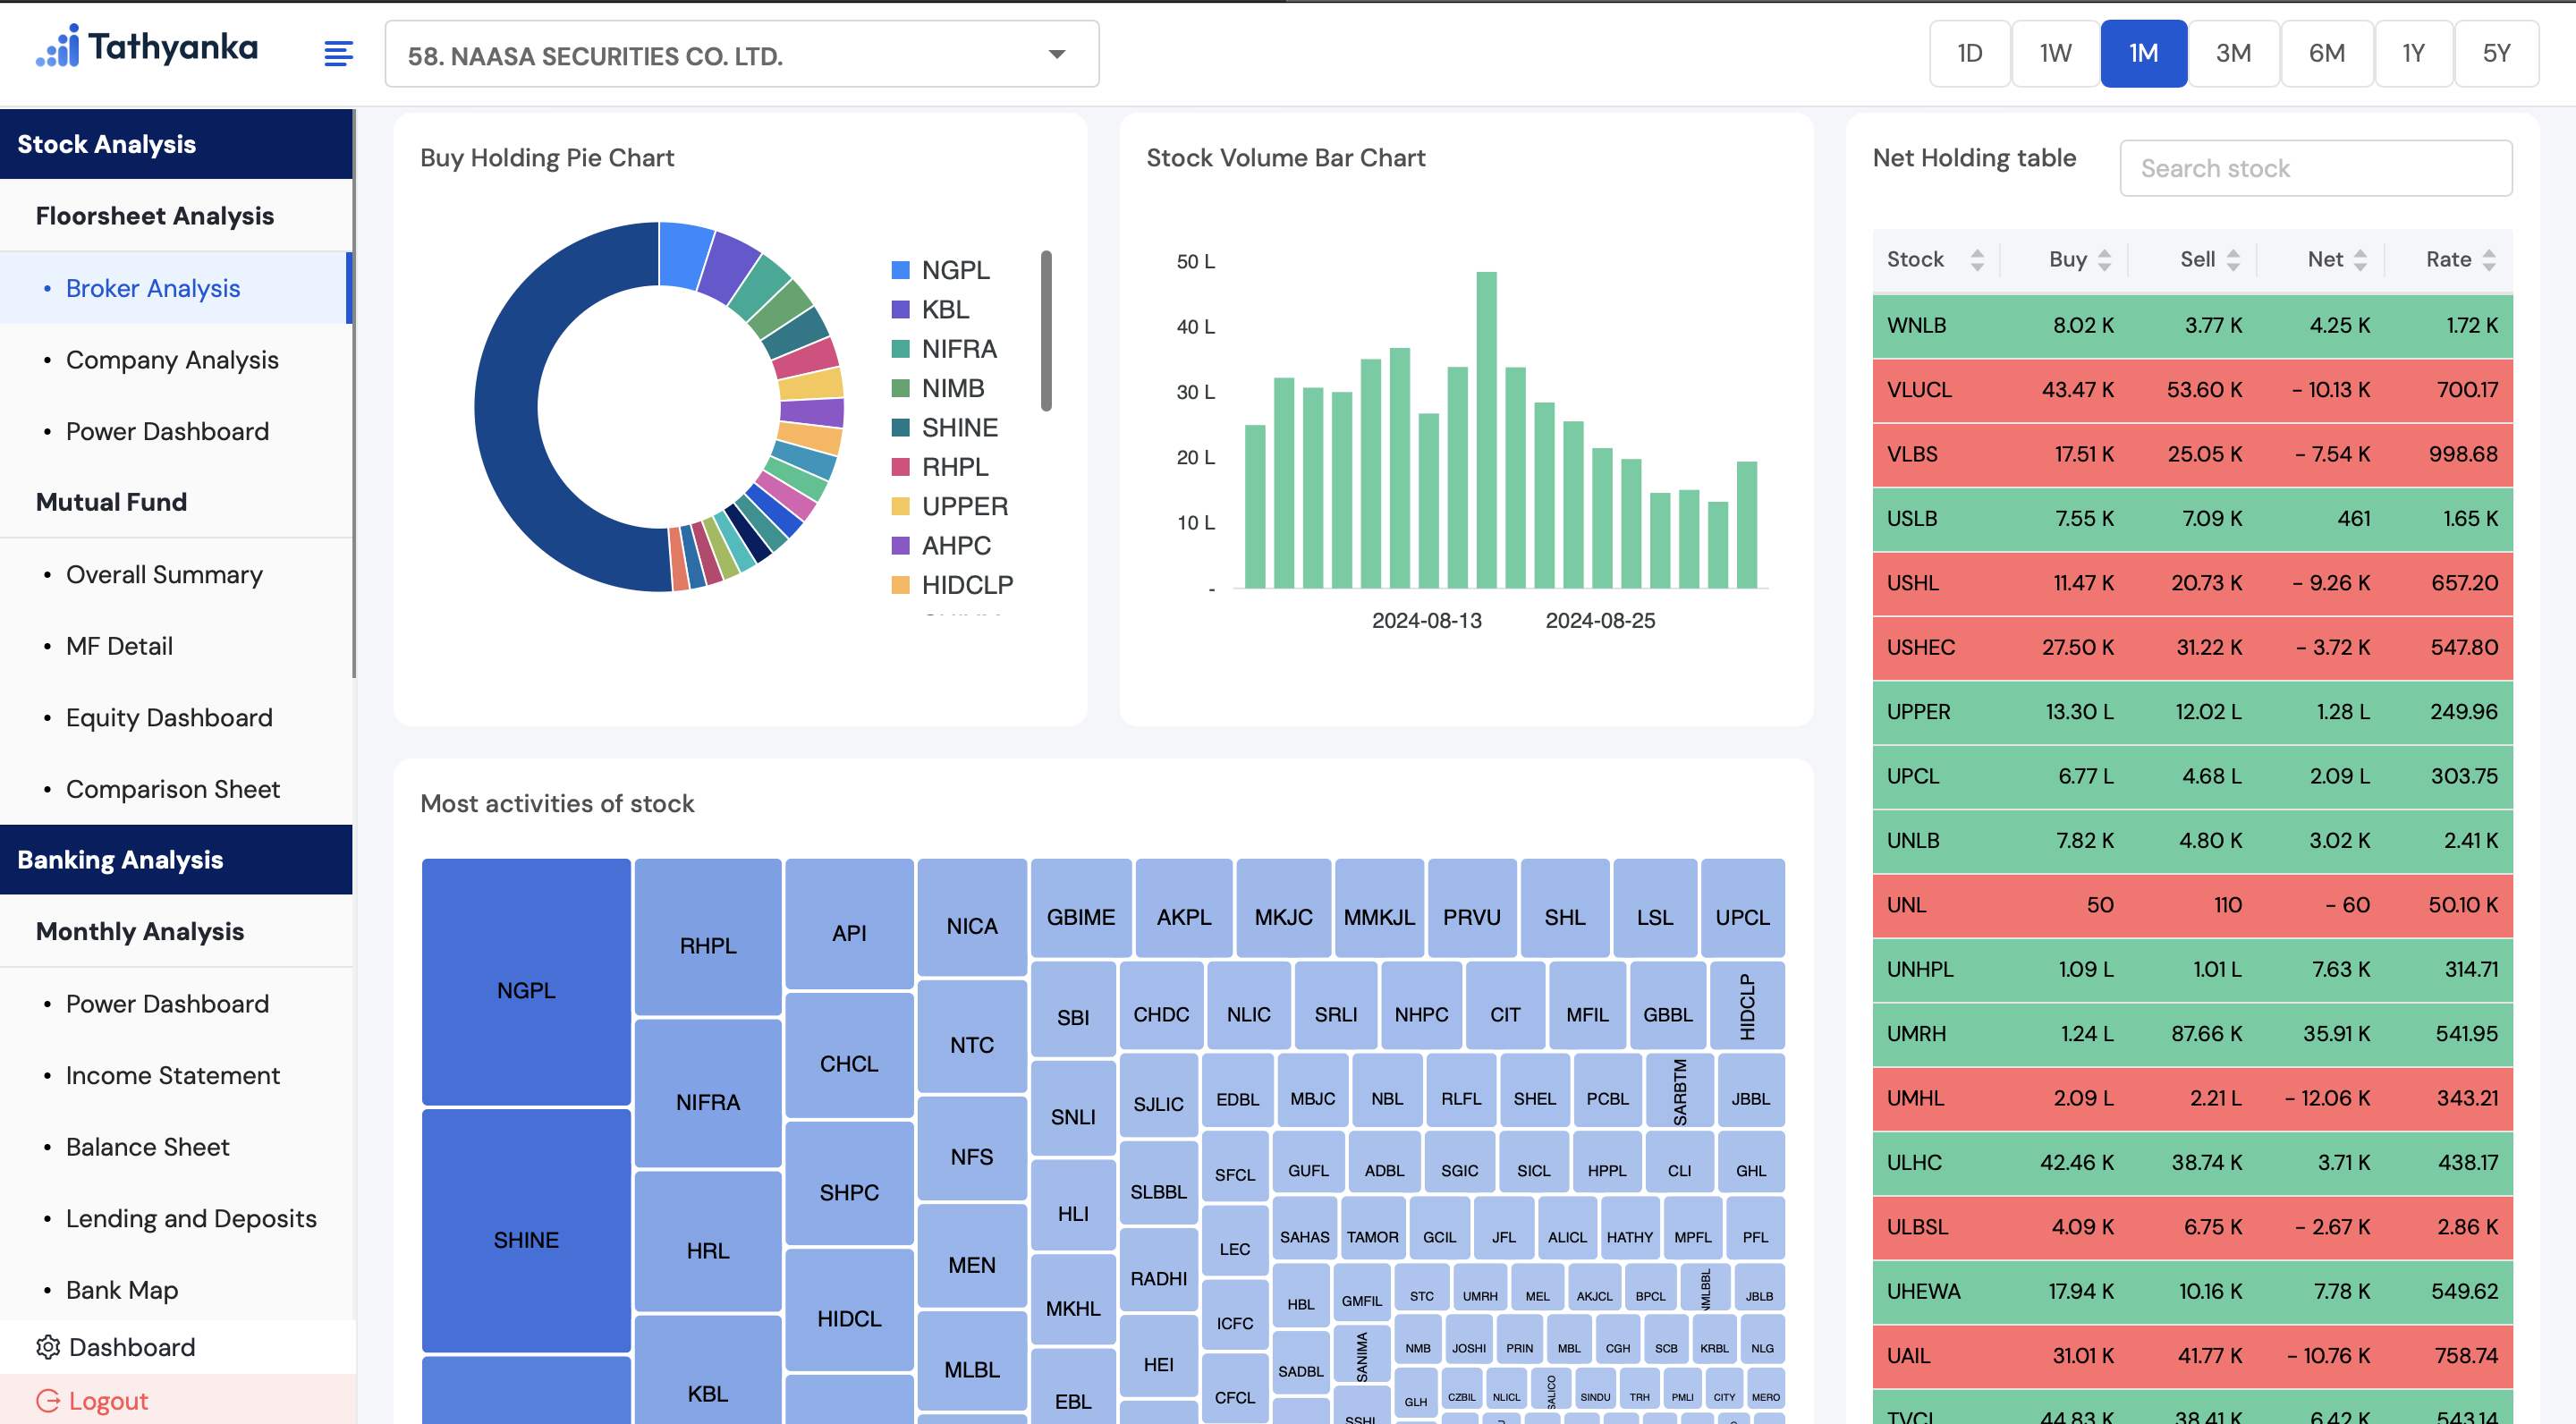
A floorsheet analysis refers to the process of examining a detailed report that captures all trades executed on a stock exchange during a specific period, typically within a trading day. It provides crucial information such as the stocks traded, the number of shares, prices, and the brokers involved in the transactions. The purpose of this analysis is to monitor market activity, identify emerging trends, and assess liquidity. By examining the trading volume and price movements, investors and analysts can gauge market sentiment and make more informed investment decisions.
Key components of a floorsheet analysis include broker analysis, company analysis, and a power dashboard. Broker analysis breaks down the activity of different brokers to highlight the most active participants in buying or selling. Company analysis focuses on the trading activity of individual companies, helping to identify the most sought-after stocks. The power dashboard provides visual insights through charts and graphs, making it easier to spot trends and compare stocks. Together, these elements offer a comprehensive view of market performance and help assess stock liquidity.
Features |
Description |
|---|---|
| Power Dashboard | The Power Dashboard provides a real-time overview of market activities, including stock prices, trading volumes, and volatility. It helps traders make informed decisions by offering customizable data visualization tools such as charts and heat maps, as well as real-time alerts on market shifts. Users can tailor the dashboard to track their preferred stocks, sectors, or brokers. |
| Broker Analysis | Broker Analysis offers an in-depth look at how different brokers operate, focusing on their trading volumes, strategies, and market impact. It provides insights into broker performance, helping investors select brokers that align with their needs. Key metrics include broker rankings, order execution speed, and client satisfaction rates. |
| Company Analysis | Company Analysis evaluates individual companies' stock performance, financial health, and market standing. It includes data on trading behavior, financial statements, and key ratios, helping investors assess a company’s growth potential and stability. The analysis also considers external factors such as industry trends and competitive positioning. |
b. Mutual Fund Analysis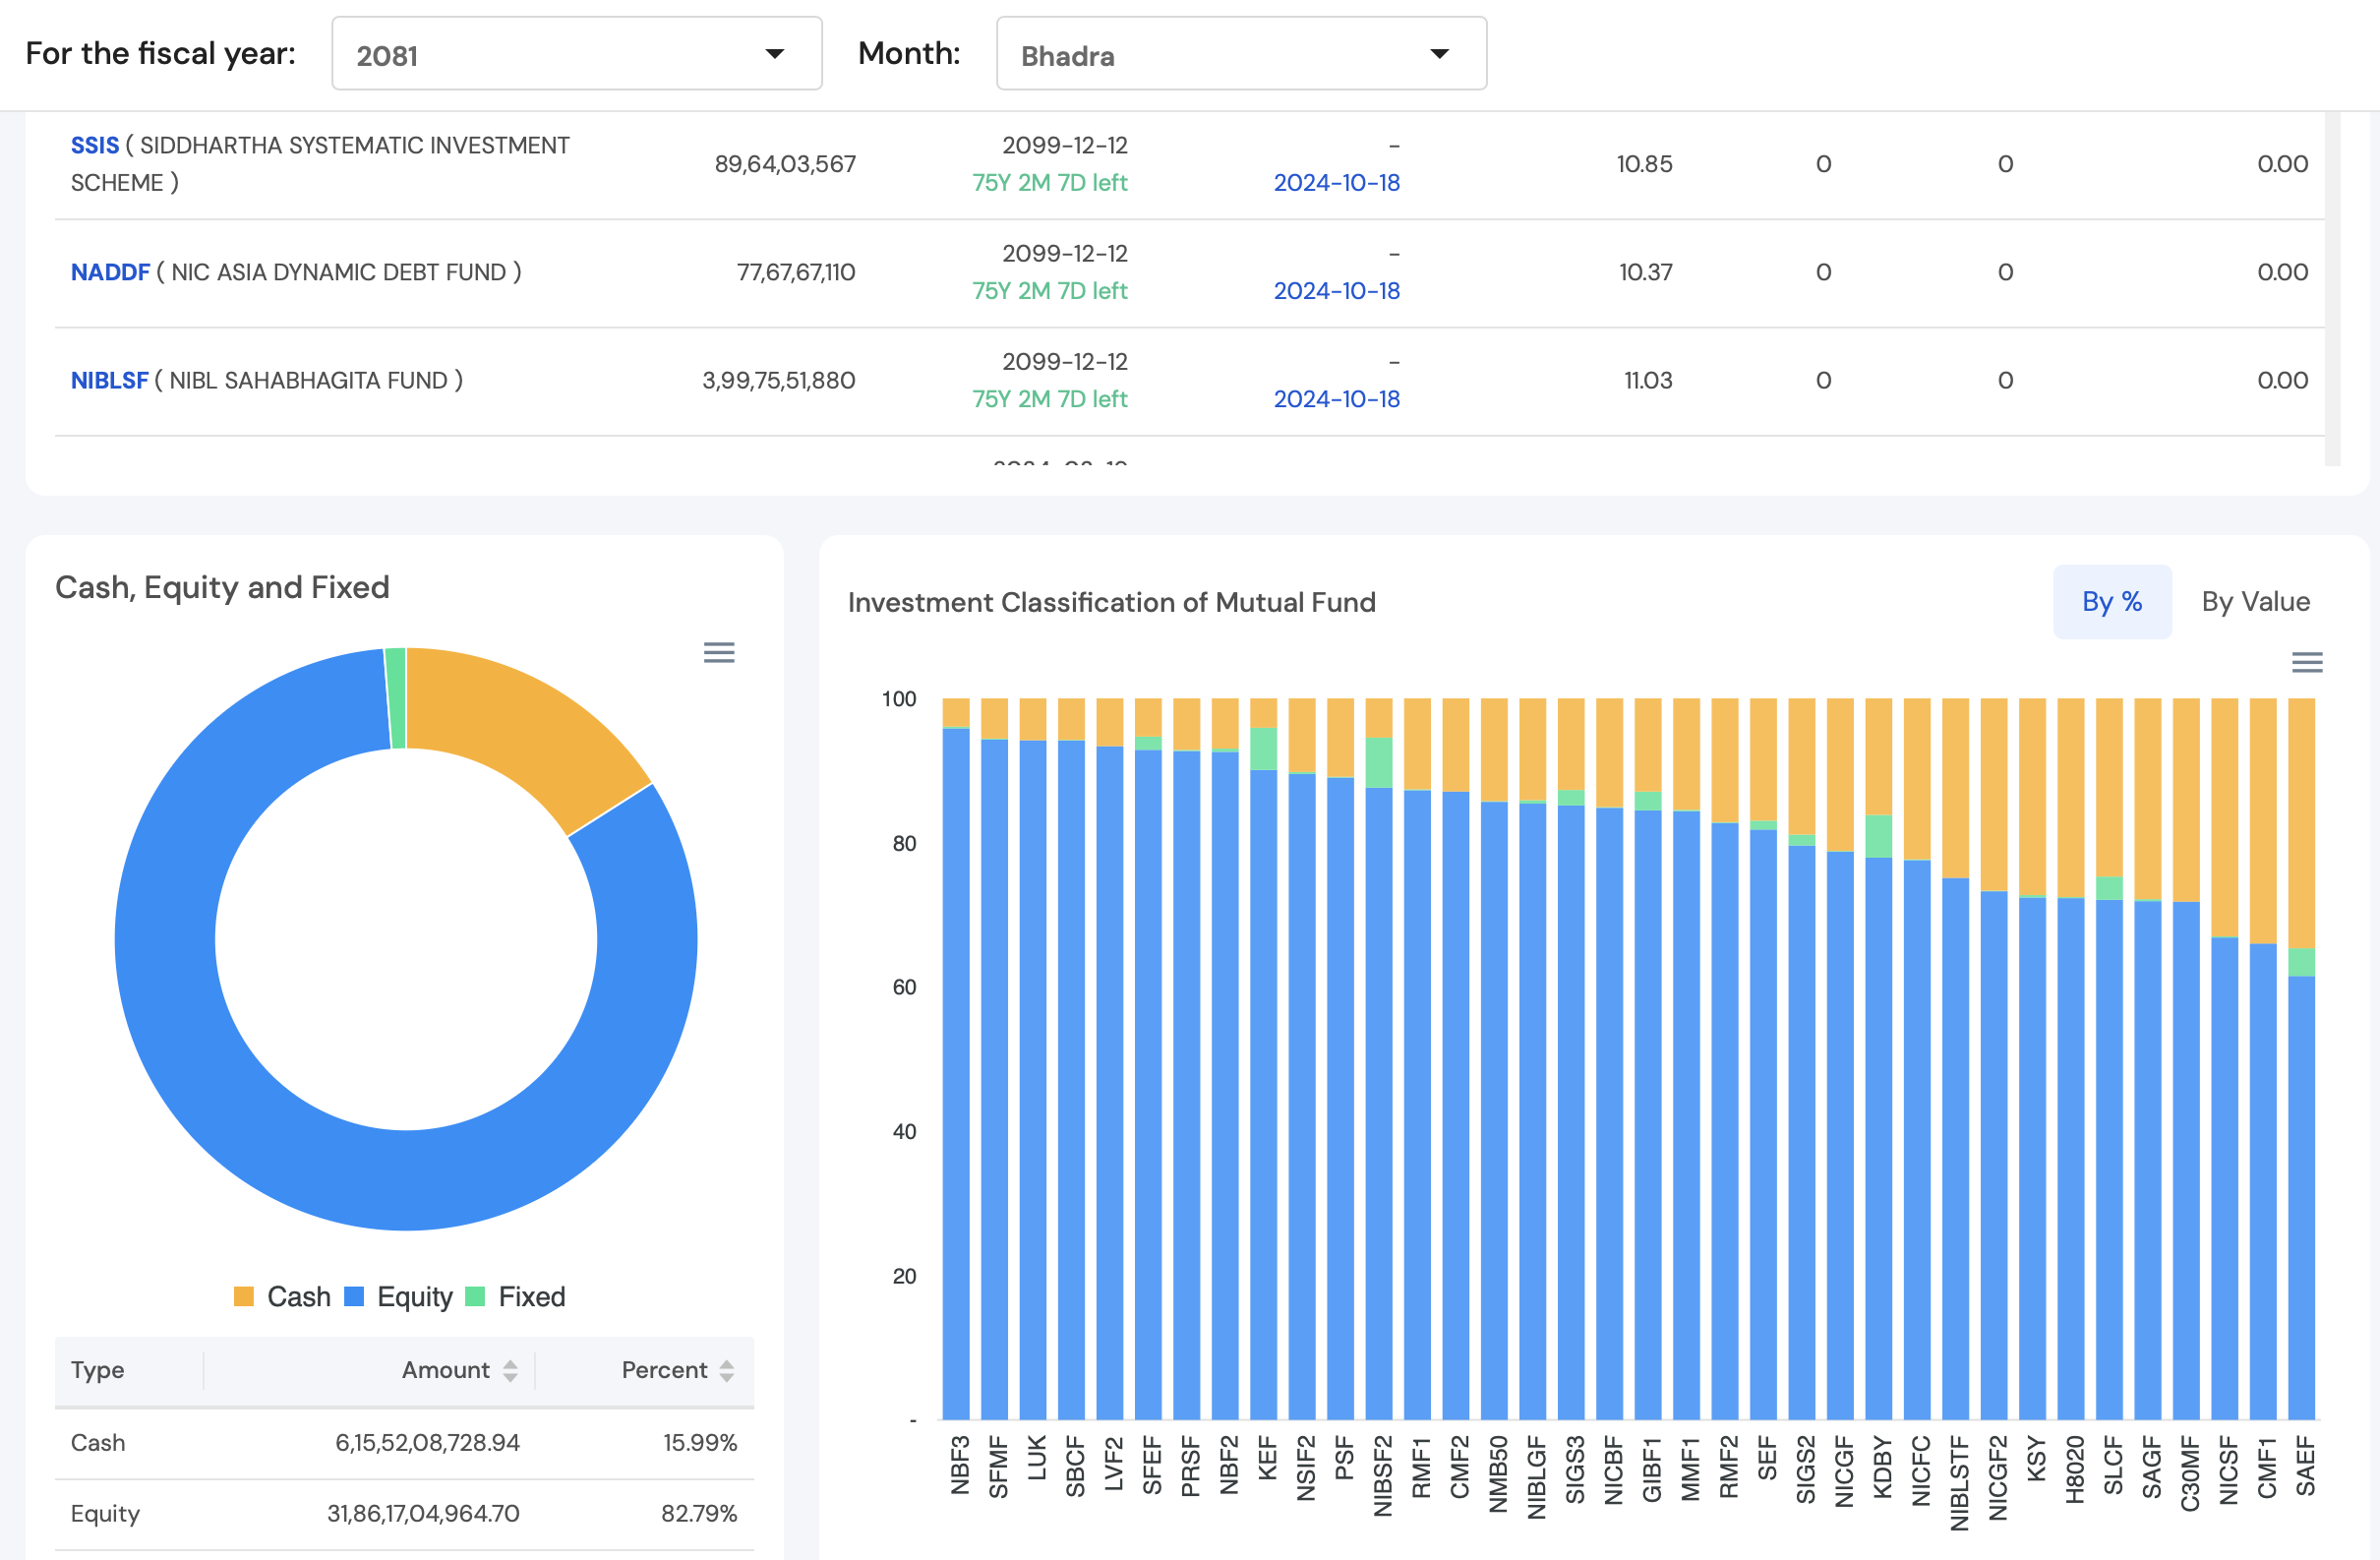
Mutual fund analysis is a comprehensive process designed to evaluate the investment potential and suitability of a mutual fund for investors. This analysis involves examining both quantitative metrics, such as past performance, expense ratios, and risk factors, as well as qualitative factors like the fund manager's expertise and the investment strategy. By combining these two approaches, investors gain a well-rounded understanding of a fund’s potential risks and rewards. This process helps guide informed investment decisions that align with an investor's financial goals, risk tolerance, and long-term objectives.
The analysis typically includes key components such as an overall mutual fund summary, which offers a snapshot of the fund's performance and key characteristics, and an equity dashboard, which visually represents the fund’s portfolio composition and trends. Additionally, a comparison sheet allows investors to benchmark the fund against similar options, facilitating a side-by-side evaluation of performance, fees, and risk. Lastly, a detailed analysis of each mutual fund provides a deeper dive into specific aspects, such as sector allocations and historical returns, ensuring a thorough evaluation before making investment decisions.
Features |
Description |
|---|---|
| Power Dashboard | The Power Dashboard offers a real-time view of market trends, stock price movements, and key performance indicators (KPIs) for mutual funds. It helps investors make quick and informed decisions through visual data tools like charts, graphs, and customizable reports, allowing a comprehensive market overview. |
| MF Detail | MF Detail provides an in-depth analysis of individual mutual funds, covering their historical performance, portfolio composition, expense ratios, fund manager strategy, and risk levels. It helps investors assess the suitability of the fund for their financial goals and risk appetite. |
| Comparison Sheet | The Comparison Sheet enables side-by-side evaluations of multiple mutual funds. It covers key metrics such as past returns, volatility, asset allocation, and fees, allowing investors to compare funds and identify the ones best suited to their investment objectives and risk tolerance. |
| Equity Dashboard | The Equity Dashboard focuses specifically on the equity portion of mutual funds, providing detailed insights into the stocks held by the fund, sector allocation, and equity performance. It highlights the fund’s exposure to different industries and markets, helping investors evaluate growth potential. |